Marketo Measure (Bizible) Dynamics CRM Reports to Build
- Subscribe to RSS Feed
- Mark as New
- Mark as Read
- Bookmark
- Subscribe
- Printer Friendly Page
- Report Inappropriate Content
- Mark as New
- Bookmark
- Subscribe
- Mute
- Subscribe to RSS Feed
- Permalink
- Report Inappropriate Content
Are you a new Marketo Measure (formerly known as Bizible) customer using Dynamics? Or maybe you’re just new to reporting with Marketo Measure data in Dynamics? This post is for you!
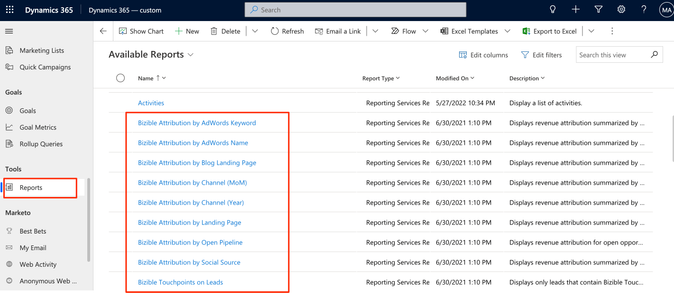
If you’ve already installed the Marketo Measure solution into your Dynamics environment, you’ll notice that it comes with some starting reports (shown in the 1st picture below). This is great, but they’re not quite ready to go – they need some tweaking to be useful.
These instructions are meant to outline the steps to take to get useful reports. We will be building 2 reports together:
- Buyer Touchpoints by Lead ID
- Buyer Attribution Touchpoints by Opportunity ID
First, navigate to “Reports.” For me, that’s accessed under the Tools section as you’ll see in the screenshot below.
*Note, although Marketo Measure is the new name – we haven’t updated the CRM solution yet so you may still see “Bizible” naming conventions in your CRM org.
Let’s build the Buyer Touchpoints by Lead ID report first. We’ll build from the existing report titled “Bizible Touchpoints on Leads,” so click into that.
Next, click File --> Report Wizard
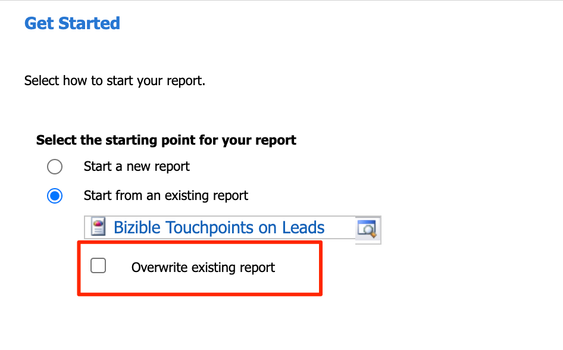
In the pop-up window that appears, de-select “Overwrite existing report”:
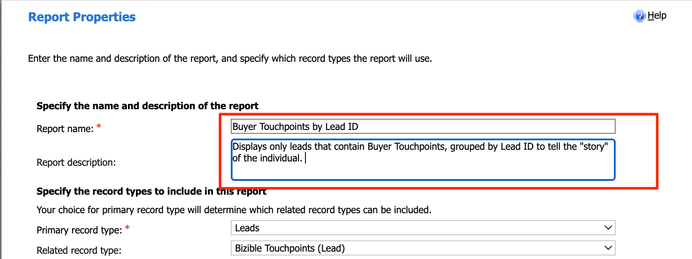
Give the report a name, I recommend “Buyer Touchpoints by Lead ID.”
Next is where we filter the report to show ONLY Leads that do have Buyer Touchpoints. To do this, make the following adjustments:
*Note that this is also where you’d add any wanted filters for date/date type criteria^^
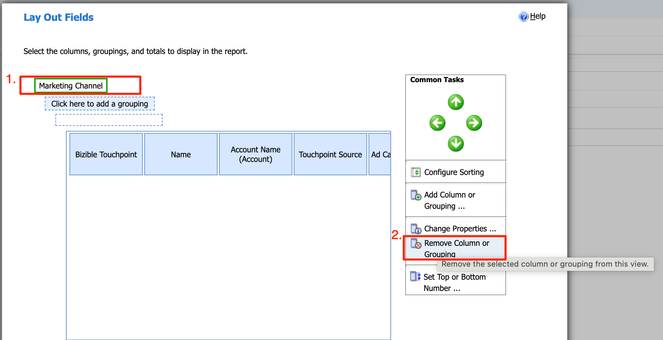
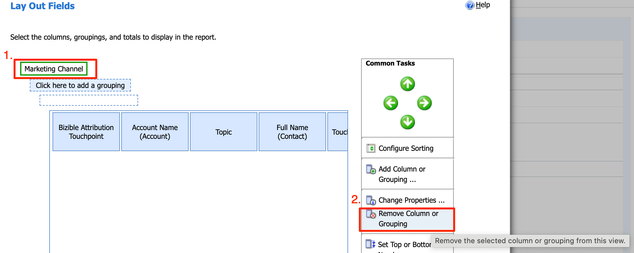
Next, remove the existing grouping by clicking onto “Marketing Channel” and then clicking the button to “Remove Column or Grouping”:
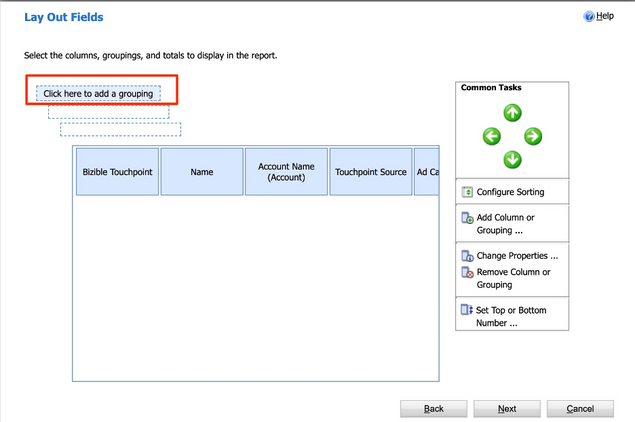
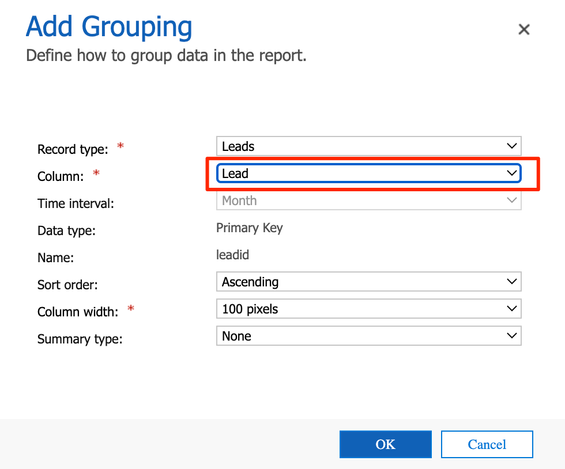
Now click “Click here to add a grouping”:
Make the following selections:
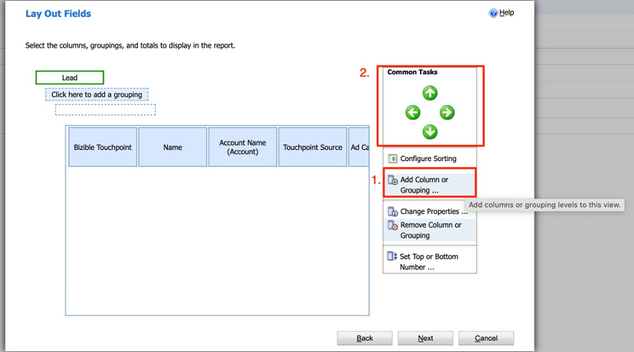
Now we’re going to use the following controls to customize which columns (attributes) display in the report and in what order:
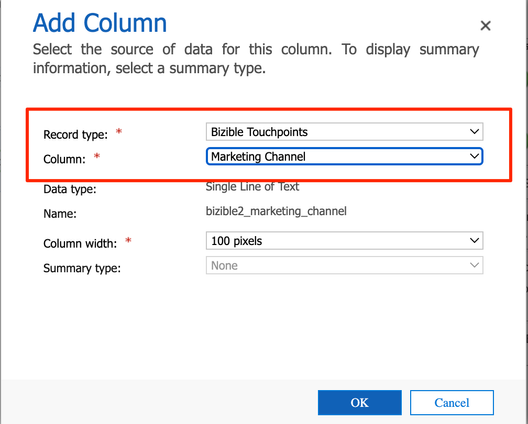
We’ll do one together, so click “Add Column or Grouping.” Then make the following adjustment:
You’ll then use the green arrows to move the column as needed in the report:
Please add the following columns in this order:
Bizible Touchpoint
Name
Account Name (Account)
Marketing Channel
Ad Campaign Name
Touchpoint Type
Touchpoint Position
Touchpoint Date
Count – First Touch (in the properties, make sure to Sum)
Count – Lead Creation Touch (in the properties, make sure to Sum)
Count – U-Shaped (in the properties, make sure to Sum)
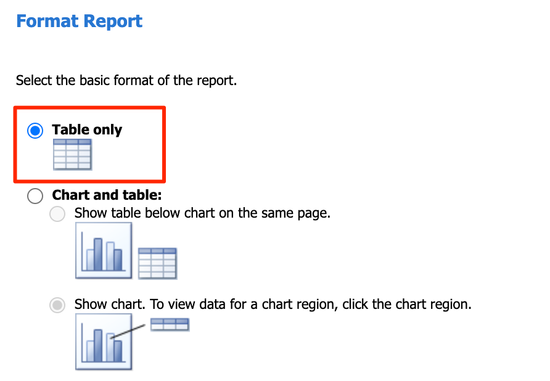
On the next screen, select Table only:
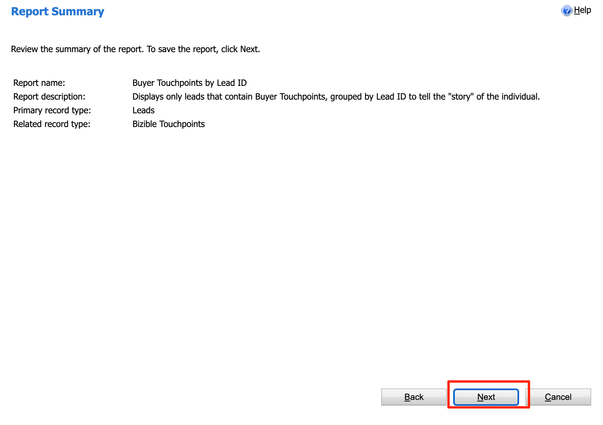
On the next window, hit “Next”:
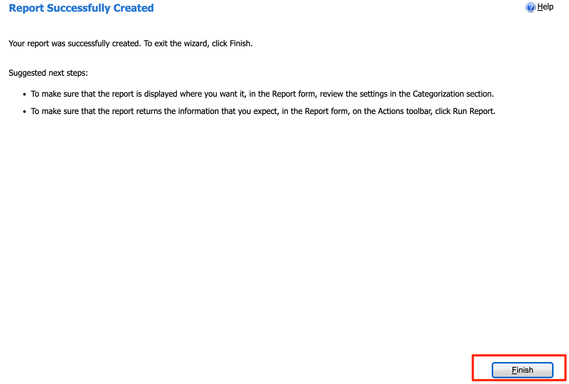
The new report has now been created, hit “Finish”:
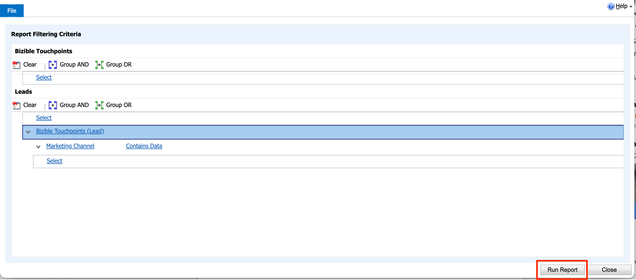
The pop-up window will close, and you’ll then be able to click “Run Report” in the original window:
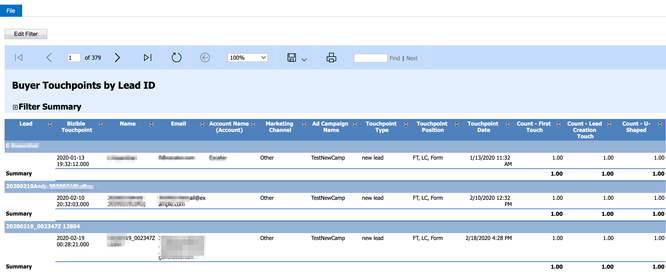
Awesome! Now you can use this report to understand the chronological journey of your new Leads! The structure should look like the following:
Let’s now work our way a bit further down the funnel and built a report that incorporates Opportunities. This time, we’ll start with the pre-existing report titled “Bizible Attribution by Open Pipeline”
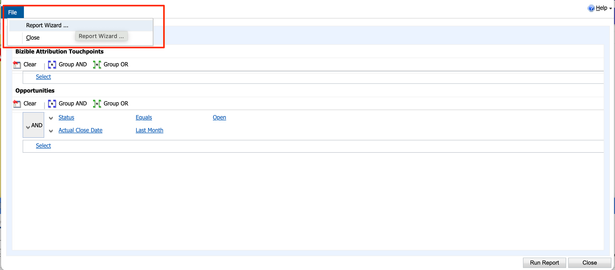
Same as last time, we’ll click File --> Report Wizard so that we can build and save a new report:
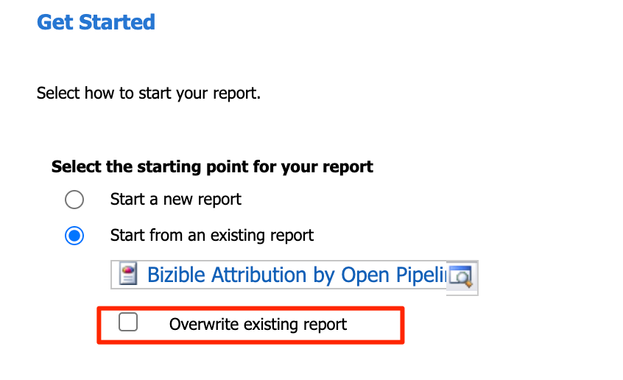
In the window that pops up, de-select “Overwrite existing report”:
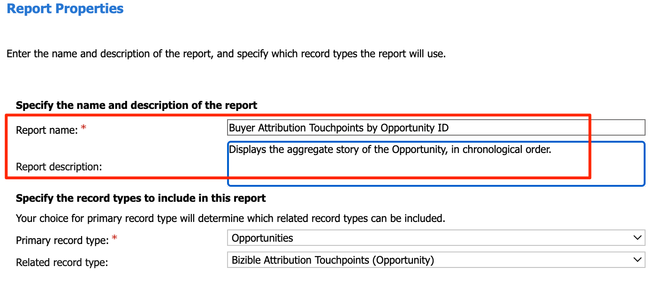
Name the report “Buyer Attribution Touchpoints by Opportunity ID”:
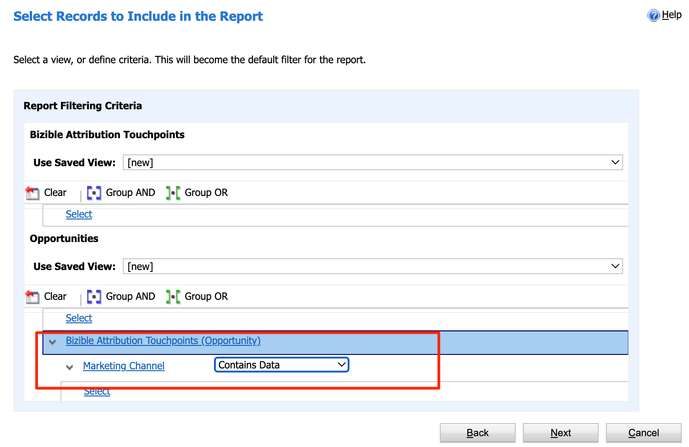
Make the following adjustments on the next window to ensure that only Opportunities that do have Buyer Attribution Touchpoints show up on the report. Note that this is also where you’d do any other filtering wanted (Opp Type, Opp Stage/Status, Date range, etc.).
Next remove any groupings:
Then add/remove columns as needed to get to this order/selection:
Bizible Attribution Touchpoint
Account Name (Account)
Status
Full Name (Contact)
Ad Campaign Name
Touchpoint Type
Touchpoint Position
Touchpoint Date
Attribution % W-Shaped
Count – W-Shaped (in the properties, make sure to Sum)
Revenue – W-Shaped (in the properties, make sure to Sum)
On the next window, select “Table only”:
Then click “Finish” on the next window. The pop-up window will close, and you’ll then be able to click “Run Report” on the original window.
The structure of your report should look like the following:
That’s it!
Check out this post for more Marketo Measure (Bizible) Dynamics reporting tips: https://nation.marketo.com/t5/marketo-whisperer-blogs/reporting-tips-for-bizible-dynamics-users/ba-p...
You must be a registered user to add a comment. If you've already registered, sign in. Otherwise, register and sign in.
- Copyright © 2025 Adobe. All rights reserved.
- Privacy
- Community Guidelines
- Terms of use
- Do not sell my personal information
Adchoices
